P. Schäfer, N. Rodrigues, D. Weiskopf, and S. Storandt, “Group Diagrams for Simplified Representation of Scanpaths,” in
Proceedings of the ACM Symposium on Visual Information Communication and Interaction (VINCI), in Proceedings of the ACM Symposium on Visual Information Communication and Interaction (VINCI). ACM, Aug. 2022. doi:
10.1145/3554944.3554971.
Abstract
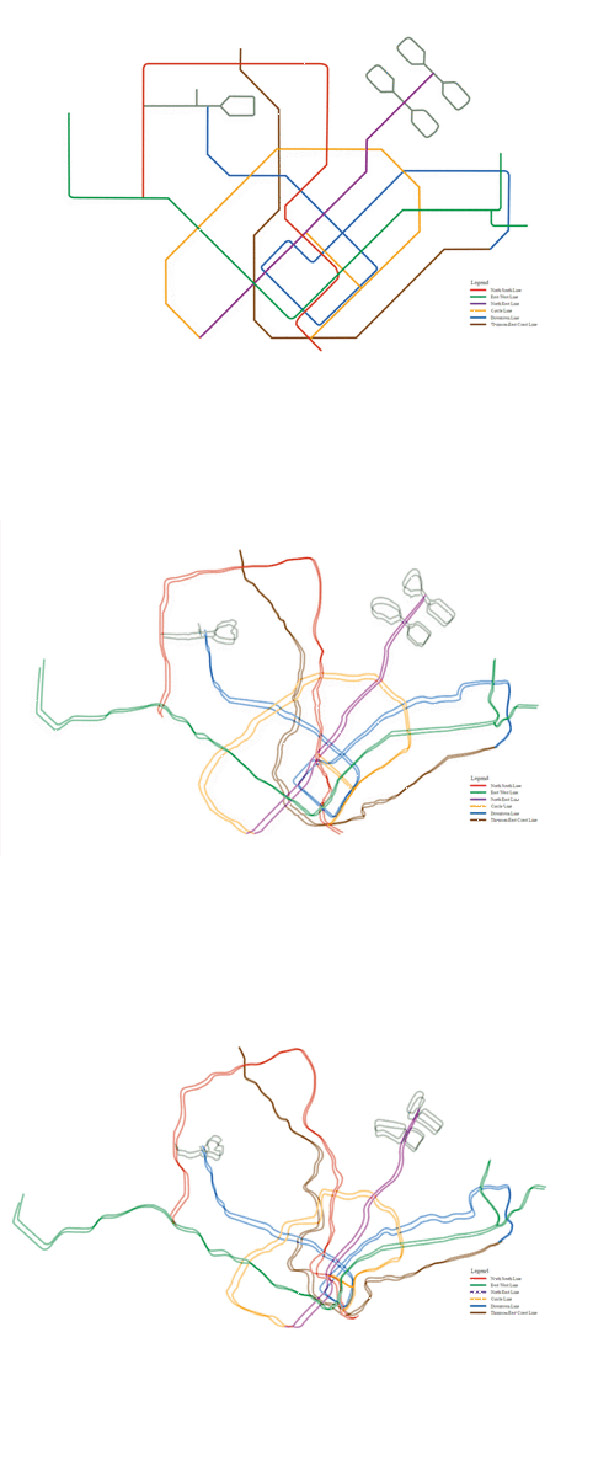
We instrument Group Diagrams (GDs) to reduce clutter in sets
of eye-tracking scanpaths. Group Diagrams consist of trajectory
subsets that cover, or represent, the whole set of trajectories with
respect to some distance measure and an adjustable distance threshold.
The original GDs allow for an application of various distance
measures. We implement the GD framework and evaluate it on
scanpaths that were collected by a former user study on public transit
maps. We find that the Fréchet distance is the most appropriate
measure to get meaningful results, yet it is flexible enough to cover
outliers.We discuss several implementation-specific challenges and
improve the scalability of the algorithm.BibTeX
Y. Zhang, K. Klein, O. Deussen, T. Gutschlag, and S. Storandt, “Robust Visualization of Trajectory Data,”
it - Information Technology, vol. 64, no. 4–5, Art. no. 4–5, 2022, doi:
doi:10.1515/itit-2022-0036.
Abstract
The analysis of movement trajectories plays a central role in many application areas, such as traffic management, sports analysis, and collective behavior research, where large and complex trajectory data sets are routinely collected these days. While automated analysis methods are available to extract characteristics of trajectories such as statistics on the geometry, movement patterns, and locations that might be associated with important events, human inspection is still required to interpret the results, derive parameters for the analysis, compare trajectories and patterns, and to further interpret the impact factors that influence trajectory shapes and their underlying movement processes. Every step in the acquisition and analysis pipeline might introduce artifacts or alterate trajectory features, which might bias the human interpretation or confound the automated analysis. Thus, visualization methods as well as the visualizations themselves need to take into account the corresponding factors in order to allow sound interpretation without adding or removing important trajectory features or putting a large strain on the analyst. In this paper, we provide an overview of the challenges arising in robust trajectory visualization tasks. We then discuss several methods that contribute to improved visualizations. In particular, we present practical algorithms for simplifying trajectory sets that take semantic and uncertainty information directly into account. Furthermore, we describe a complementary approach that allows to visualize the uncertainty along with the trajectories.BibTeX
S. Cornelsen
et al., “Drawing Shortest Paths in Geodetic Graphs,” in
Graph Drawing and Network Visualization, D. Auber and P. Valtr, Eds., in Graph Drawing and Network Visualization. Cham: Springer International Publishing, 2020, pp. 333--340. doi:
10.1007/978-3-030-68766-3_26.
Abstract
Motivated by the fact that in a space where shortest paths are unique, no two shortest paths meet twice, we study a question posed by Greg Bodwin: Given a geodetic graph G, i.e., an unweighted graph in which the shortest path between any pair of vertices is unique, is there a philogeodetic drawing of G, i.e., a drawing of G in which the curves of any two shortest paths meet at most once? We answer this question in the negative by showing the existence of geodetic graphs that require some pair of shortest paths to cross at least four times. The bound on the number of crossings is tight for the class of graphs we construct. Furthermore, we exhibit geodetic graphs of diameter two that do not admit a philogeodetic drawing.BibTeX
P. Angelini, S. Chaplick, S. Cornelsen, and G. Da Lozzo, “Planar L-Drawings of Bimodal Graphs,” in
Graph Drawing and Network Visualization, D. Auber and P. Valtr, Eds., in Graph Drawing and Network Visualization. Cham: Springer International Publishing, 2020, pp. 205–219. doi:
10.1007/978-3-030-68766-3_17.
Abstract
In a planar L-drawing of a directed graph (digraph) each edge e is represented as a polyline composed of a vertical segment starting at the tail of e and a horizontal segment ending at the head of e. Distinct edges may overlap, but not cross. Our main focus is on bimodal graphs, i.e., digraphs admitting a planar embedding in which the incoming and outgoing edges around each vertex are contiguous. We show that every plane bimodal graph without 2-cycles admits a planar L-drawing. This includes the class of upward-plane graphs. Finally, outerplanar digraphs admit a planar L-drawing -- although they do not always have a bimodal embedding -- but not necessarily with an outerplanar embedding.BibTeX
T. Stankov and S. Storandt, “Maximum Gap Minimization in Polylines,” in
Web and Wireless Geographical Information Systems - 18th International Symposium, W2GIS 2020, Wuhan, China, November 13-14, 2020, Proceedings, in Web and Wireless Geographical Information Systems - 18th International Symposium, W2GIS 2020, Wuhan, China, November 13-14, 2020, Proceedings. 2020, pp. 181--196. doi:
10.1007/978-3-030-60952-8\_19.
Abstract
Given a polyline consisting of n segments, we study the problem of selecting k of its segments such that the maximum induced gap length without a selected segment is minimized. This optimization problem has applications in the domains of trajectory visualization and facility location. We design several heuristics and exact algorithms for simple polylines, along with algorithm engineering techniques to achieve good practical running times even for large values of n and k. The fastest exact algorithm is based on dynamic programming and exhibits a running time of O(nk) while using space linear in n. Furthermore, we consider incremental problem variants. For the case where a given set of k segments shall be augmented by a single additional segment, we devise an optimal algorithm which runs in O(k + log n) on a suitable polyline representation. If not only a single segment but k' segments shall be added, we can compute the optimal segment set in time O(nk') by modifying the dynamic programming approach for the original problem. Experiments on large sets of real-world trajectories as well as artificial polylines show the trade-offs between quality and running time of the different approaches.BibTeX
H. Bast, P. Brosi, and S. Storandt, “Metro Maps on Octilinear Grid Graphs,” in
Computer Graphics Forum, in Computer Graphics Forum. Hoboken, New Jersey: Wiley-Blackwell - STM, 2020, pp. 357--367. doi:
10.1111/cgf.13986.
Abstract
Schematic transit maps (often called "metro maps" in the literature) are important to produce comprehensible visualizations of complex public transit networks. In this work, we investigate the problem of automatically drawing such maps on an octilinear grid with an arbitrary (but optimal) number of edge bends. Our approach can naturally deal with obstacles that should be respected in the final drawing (points of interest, rivers, coastlines) and can prefer grid edges near the real-world course of a line. This allows our drawings to be combined with existing maps, for example as overlays in map services. We formulate an integer linear program which can be used to solve the problem exactly. We also provide a fast approximation algorithm which greedily calculates shortest paths between node candidates on the underlying octilinear grid graph. Previous work used local search techniques to update node positions until a local optimum was found, but without guaranteeing octilinearity. We can thus calculate nearly optimal metro maps in a fraction of a second even for complex networks, enabling the interactive use of our method in map editors.BibTeX
M. Beck and S. Storandt, “Puzzling Grid Embeddings,” in
Proceedings of the Symposium on Algorithm Engineering and Experiments, ALENEX 2020, Salt Lake City, UT, USA, January 5-6, 2020, in Proceedings of the Symposium on Algorithm Engineering and Experiments, ALENEX 2020, Salt Lake City, UT, USA, January 5-6, 2020. 2020, pp. 94--105. doi:
10.1137/1.9781611976007.8.
Abstract
We present a pipeline that, given a weighted graph as an input, produces a planar grid embedding where all edges are represented as axis-aligned straight lines with their Euclidean length matching their edge weight (if such an embedding exists). Being able to compute such embeddings is important for visualization purposes but is additionally helpful to solve certain optimization problems faster, as e.g. the Steiner tree problem. Our embedding pipeline consists of three main steps: In the first step, we identify rigid substructures which we call puzzle pieces. In the second step, we merge puzzle pieces if possible. In the third and last step, we compute the final embedding (or decide that such an embedding does not exist) via backtracking. We describe suitable data structures and engineering techniques for accelerating all steps of the pipeline along the way. Experiments on a large variety of input graphs demonstrate the applicability and scalability of our approach.BibTeX
J. Spoerhase, S. Storandt, and J. Zink, “Simplification of Polyline Bundles,” in
17th Scandinavian Symposium and Workshops on Algorithm Theory, SWAT 2020, June 22-24, 2020, Tórshavn, Faroe Islands, in 17th Scandinavian Symposium and Workshops on Algorithm Theory, SWAT 2020, June 22-24, 2020, Tórshavn, Faroe Islands. 2020, pp. 35:1--35:20. doi:
10.4230/LIPIcs.SWAT.2020.35.
Abstract
We propose and study a generalization to the well-known problem of polyline simplification. Instead of a single polyline, we are given a set of l polylines possibly sharing some line segments and bend points. Our goal is to minimize the number of bend points in the simplified bundle with respect to some error tolerance δ (measuring Fréchet distance) but under the additional constraint that shared parts have to be simplified consistently. We show that polyline bundle simplification is NP-hard to approximate within a factor n^(1/3 - ε) for any ε > 0 where n is the number of bend points in the polyline bundle. This inapproximability even applies to instances with only l=2 polylines. However, we identify the sensitivity of the solution to the choice of δ as a reason for this strong inapproximability. In particular, we prove that if we allow δ to be exceeded by a factor of 2 in our solution, we can find a simplified polyline bundle with no more thanO(log (l + n)) ⋅ OPT bend points in polytime, providing us with an efficient bi-criteria approximation. As a further result, we show fixed-parameter tractability in the number of shared bend points.BibTeX
H. Bast, P. Brosi, and S. Storandt, “Efficient Generation of Geographically Accurate Transit Maps,” in
Proceedings of the ACM International Conference on Advances in Geographic Information Systems (SIGSPATIAL), F. B. Kashani, E. G. Hoel, R. H. Güting, R. Tamassia, and L. Xiong, Eds., in Proceedings of the ACM International Conference on Advances in Geographic Information Systems (SIGSPATIAL). ACM, 2018, pp. 13–22. doi:
10.1145/3274895.3274955.
Abstract
We present LOOM (Line-Ordering Optimized Maps), a fully automatic generator of geographically accurate transit maps. The input to LOOM is data about the lines of a given transit network, namely for each line, the sequence of stations it serves and the geographical course the vehicles of this line take. We parse this data from GTFS, the prevailing standard for public transit data. LOOM proceeds in three stages: (1) construct a so-called line graph, where edges correspond to segments of the network with the same set of lines following the same course; (2) construct an ILP that yields a line ordering for each edge which minimizes the total number of line crossings and line separations; (3) based on the line graph and the ILP solution, draw the map. As a naive ILP formulation is too demanding, we derive a new custom-tailored formulation which requires significantly fewer constraints. Furthermore, we present engineering techniques which use structural properties of the line graph to further reduce the ILP size. For the subway network of New York, we can reduce the number of constraints from 229,000 in the naive ILP formulation to about 3,700 with our techniques, enabling solution times of less than a second. Since our maps respect the geography of the transit network, they can be used for tiles and overlays in typical map services. Previous research work either did not take the geographical course of the lines into account, or was concerned with schematic maps without optimizing line crossings or line separations.BibTeX
D. Bahrdt
et al., “Growing Balls in ℝd,” in
Proceedings of the Meeting on Algorithm Engineering and Experiments (ALENEX), S. P. Fekete and V. Ramachandran, Eds., in Proceedings of the Meeting on Algorithm Engineering and Experiments (ALENEX). SIAM, 2017, pp. 247–258. doi:
10.1137/1.9781611974768.20.
Abstract
Given a set of prioritized balls with fixed centers in ℝd whose radii grow linearly over time, we want to compute the elimination order of these balls assuming that when two balls touch, the one with lower priority is ‘crushed’. A straightforward algorithm has running time O(n2 log n) which we improve to expected O(Δdn(log n + Δd)) where Δ = rmax/rmin is the ratio between largest and smallest radius amongst the balls. For a natural application of this problem, namely drawing labels on the globe, we have Δ = O(1). An efficient implementation based on a spherical Delaunay triangulation allows to compute the elimination order for millions of labels on commodity Desktop hardware. Dealing with rounding error induced robustness issues turned out to be one of the major challenges in the implementation.BibTeX
S. Funke, T. Mendel, A. Miller, S. Storandt, and M. Wiebe, “Map Simplification with Topology Constraints: Exactly and in Practice,” in
Proceedings of the Meeting on Algorithm Engineering and Experiments (ALENEX), S. P. Fekete and V. Ramachandran, Eds., in Proceedings of the Meeting on Algorithm Engineering and Experiments (ALENEX). SIAM, 2017, pp. 185–196. doi:
10.1137/1.9781611974768.15.
Abstract
We consider the classical line simplification problem subject to a given error bound ∊ but with additional topology constraints as they arise for example in the map rendering domain. While theoretically inapproximability has been proven for these problem variants, we show that in practice one can solve medium sized instances optimally using an integer linear programming approach and larger instances using an heuristic approach which for medium-sized real-world instances yields close-to-optimal results. Our approaches are evaluated on data sets which are synthetically generated, stem from the OpenStreetMap project, and the recent GISCup competition.BibTeX
S. Funke, N. Schnelle, and S. Storandt, “URAN: A Unified Data Structure for Rendering and Navigation,” in
Web and Wireless Geographical Information Systems. W2GIS 2017. Lecture Notes in Computer Science, D. Brosset, C. Claramunt, X. Li, and T. Wang, Eds., in Web and Wireless Geographical Information Systems. W2GIS 2017. Lecture Notes in Computer Science, vol. 10181. 2017, pp. 66–82. doi:
10.1007/978-3-319-55998-8_5.
Abstract
Current route planning services like Google Maps exhibit a clear-cut separation between the map rendering component and the route planning engine. While both rely on respective road network data, the route planning task is typically performed using state-of-the art data structures for speeding-up shortest/quickest path queries like Hub Labels, Arc Flags, or Transit Nodes, whereas the map rendering task usually involves a rendering framework like Mapnik or Kartograph. In this paper we show how to augment Contraction Hierarchies – another popular data structure for speeding-up shortest path queries – to also cater for the map rendering task. As a result we get a unified data structure (URAN) which lays the algorithmic foundation for novel map rendering and navigation systems. It also allows for customization of the map rendering, e.g. to accommodate different display devices (with varying resolution and hardware capabilities) or routing scenarios. At the heart of our approach lies a generalized graph simplification scheme derived from Contraction Hierarchies with a very lightweight augmentation for extracting (simplified) subgraphs. In a client-server scenario it additionally has the potential to shift the actual route computation to the client side, both relieving the server infrastructure as well as providing some degree of privacy when planning a route.BibTeX
S. Funke, F. Krumpe, and S. Storandt, “Crushing Disks Efficiently,” in
Combinatorial Algorithms. IWOCA 2016. Lecture Notes in Computer Science, V. Mäkinen, S. J. Puglisi, and L. Salmela, Eds., in Combinatorial Algorithms. IWOCA 2016. Lecture Notes in Computer Science, vol. 9843. Springer International Publishing, 2016, pp. 43–54. doi:
10.1007/978-3-319-44543-4_4.
Abstract
Given a set of prioritized disks with fixed centers in R2 whose radii grow linearly over time, we are interested in computing an elimination order of these disks assuming that when two disks touch, the one with lower priority is ‘crushed’. A straightforward algorithm has running time O(n2logn) which we improve to expected O(n(log6n+Δ2log2n+Δ4logn)) where Δ is the ratio between largest and smallest radii amongst the disks. For a very natural application of this problem in the map rendering domain, we have Δ=O(1).BibTeX
S. Funke, A. Nusser, and S. Storandt, “On k-Path Covers and their Applications.,”
VLDB Journal, vol. 25, no. 1, Art. no. 1, 2016, doi:
10.1007/s00778-015-0392-3.
Abstract
For a directed graph G with vertex set V, we call a subset C⊆V a k-(All-)Path Cover if C contains a node from any simple path in G consisting of k nodes. This paper considers the problem of constructing small k-Path Covers in the context of road networks with millions of nodes and edges. In many application scenarios, the set C and its induced overlay graph constitute a very compact synopsis of G, which is the basis for the currently fastest data structure for personalized shortest path queries, visually pleasing overlays of subsampled paths, and efficient reporting, retrieval and aggregation of associated data in spatial network databases. Apart from a theoretic investigation of the problem, we provide efficient algorithms that produce very small k-Path Covers for large real-world road networks (with a posteriori guarantees via instance-based lower bounds). We also apply our algorithms to other (social, collaboration, web, etc.) networks and can improve in several instances upon previous approaches.BibTeX