A09 | Scalability and Complexity in Immersive Analytics
In many application areas we now see leaps to the next level in terms of scale of heterogeneous data, e.g. with technologies and techniques such as single cell profiling, spatial transcriptomics, large-scale science maps, ubiquitous sensing, and high-resolution imagery. This creates challenges regarding the cognitive and perceptual limits of a human analyst, but also creates an opportunity to exploit the affordances of mixed reality immersive environments (IE) in order to improve analysis efficiency and quality as well as the analyst's experience.
This project aims at deepening the understanding of scale and complexity effects for data analysis in IE. To this end, the scale and complexity space for immersive analytics will be characterised, and effects and limits of scale and complexity dimensions will be quantified. In a combination of methodological work and user studies, we will investigate the use of abstraction and aggregation methods and the potential and impact of navigation concepts for scalability.
Research Questions
Which scale and complexity of data representations can humans perceive and handle in an IE?
What are appropriate measures to evaluate scale and complexity effects on performance, memorability, user experience, and mental map creation?
What is the impact on visual explainability and confidence when different types and levels of abstractions are used in IE?
What is the impact of IE environment characteristics over different levels of scale?

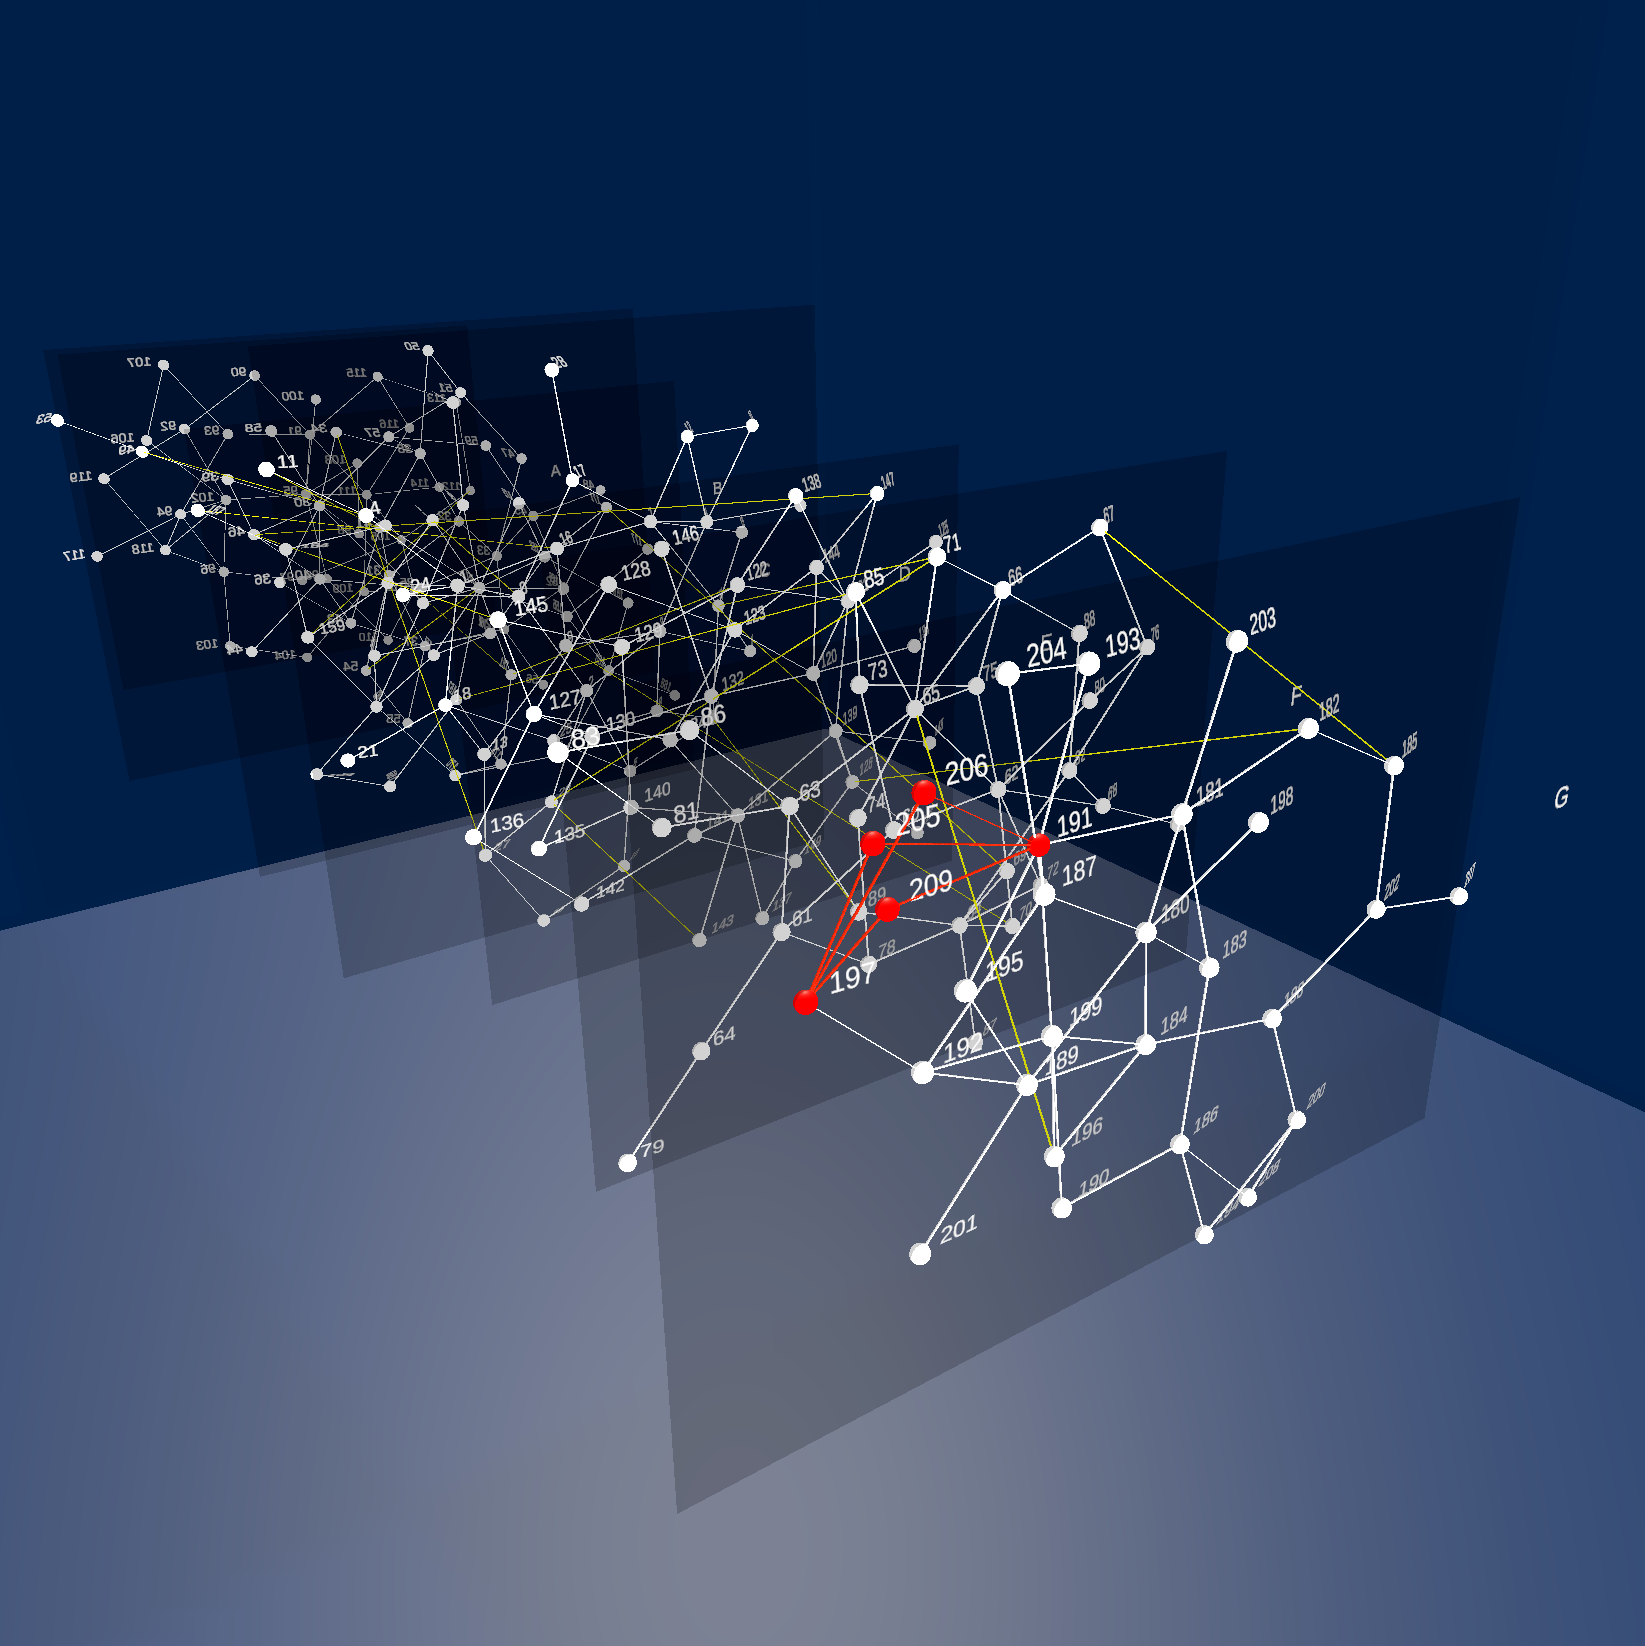
Fig. 1: Evaluation of readability for multilayer network representations in VR
Publications
- P. Eades et al., “CelticGraph: Drawing Graphs as Celtic Knots and Links,” in Graph Drawing and Network Visualization, M. A. Bekos and M. Chimani, Eds., Cham: Springer Nature Switzerland, 2024, pp. 18–35. doi: 10.1007/978-3-031-49272-3_2.
- Y. Zhang, H. Williams, F. Schreiber, and K. Klein, “Visualising the Invisible : Exploring Approaches for Visual Analysis of Dynamic Airflow in Geographic Environments Using Sensor Data,” in Proceedings of the EuroVis Workshop on Visual Analytics 2024, Eindhoven, 2024. doi: 10.2312/eurova.20241117.
- Y. Wang, Q. Dai, M. Bâce, K. Klein, and A. Bulling, “Saliency3D: a 3D Saliency Dataset Collected on Screen,” in Proc. ACM International Symposium on Eye Tracking Research and Applications (ETRA), ACM, 2024, pp. 1–6. doi: 10.1145/3649902.3653350.
- W. Kerle-Malcharek, S. P. Feyer, F. Schreiber, and K. Klein, “GAV-VR: An Extensible Framework for Graph Analysis and Visualisation in Virtual Reality,” in ICAT-EGVE 2023 - International Conference on Artificial Reality and Telexistence and Eurographics Symposium on Virtual Environments, J.-M. Normand, M. Sugimoto, and V. Sundstedt, Eds., The Eurographics Association, 2023. doi: 10.2312/egve.20231321.
Project Group A
Models and Measures
Completed
Project Group B
Adaptive Algorithms
Completed
Project Group C
Interaction
Completed
Project Group D
Applications
Completed


