B02 | Adaptive Network Visualization
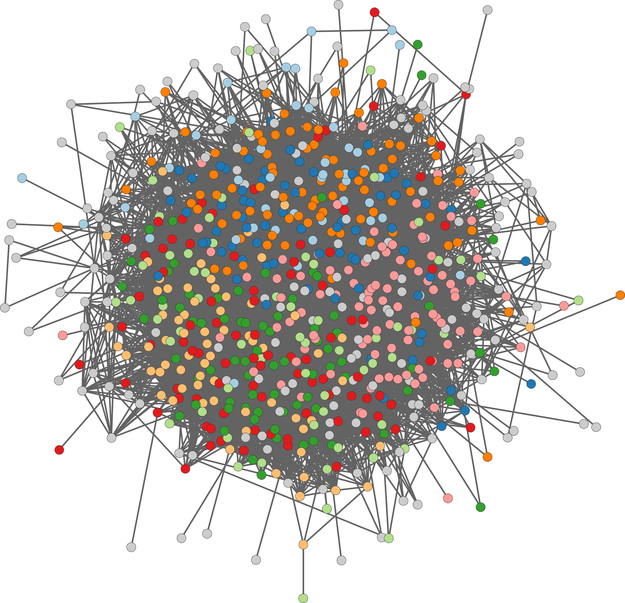
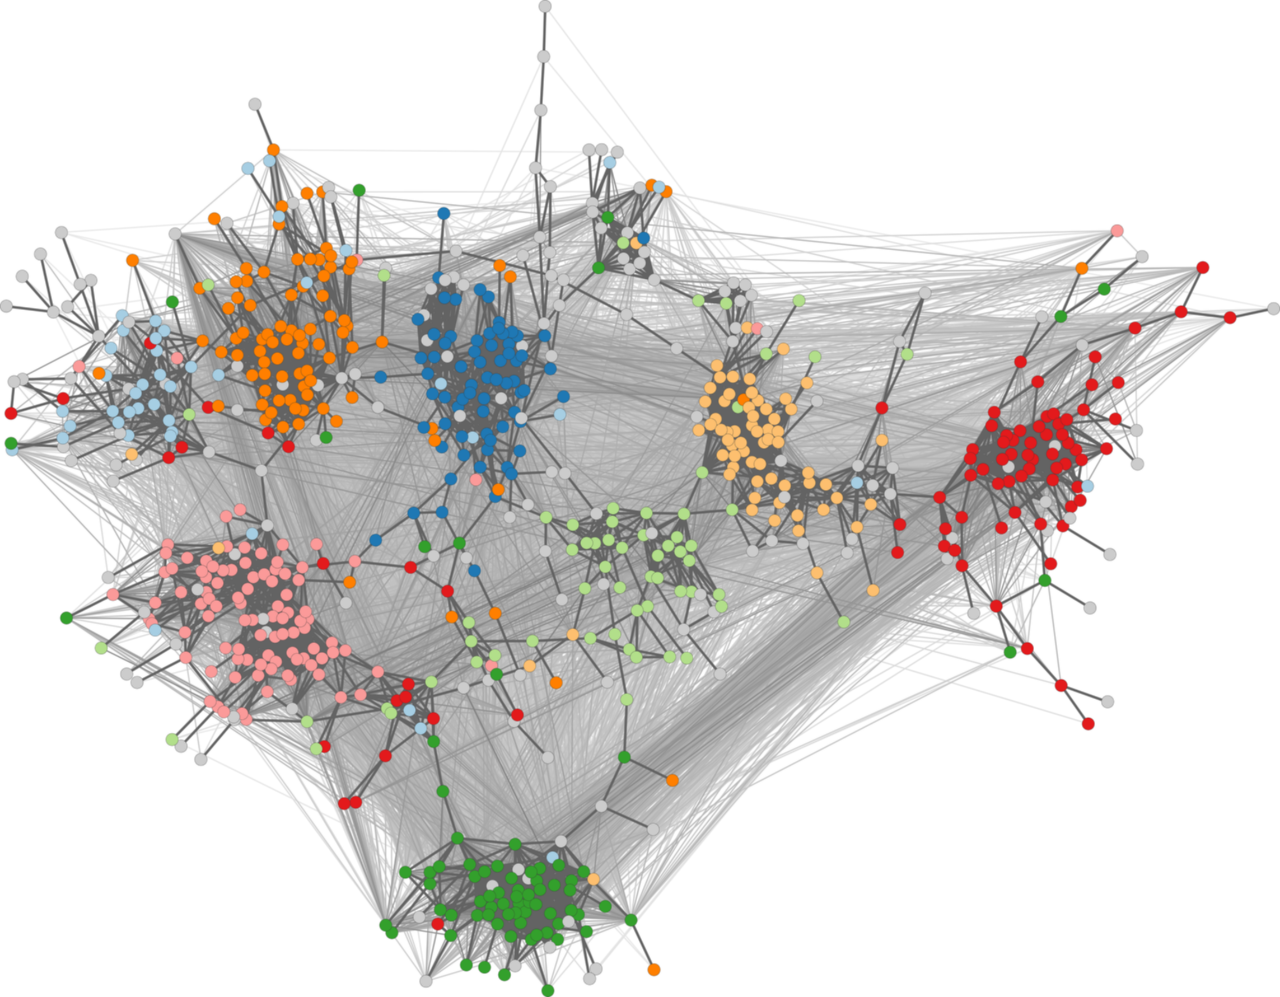
We plan to extend stress-minimization approaches for general graph layout. Current algorithms fail on specific classes of input graphs, for instance because of scale, diameter, or skewed degree distributions. Moreover, characteristics of the output device and user interactions are generally ignored. Adaptive algorithms shall be developed from quantitative descriptions of the effects of graph characteristics on layout features. Since extensive algorithmic experimentation will be required to understand empirically the response curves of such algorithms, we will also contribute to methodology in experimental algorithmics.
Research Questions
What are appropriate means of adaptation in network information visualization?
Can we make reliable quantitative predictions about the relation between adaptations and layout effects?
Which experiment-design techniques from other disciplines can be adopted to improve the study of algorithm behavior?
Can we improve the parametrization of graph layout algorithms?
Publications
- C. Schulz et al., “A Framework for Pervasive Visual Deficiency Simulation,” in Proceedings of the IEEE Conference on Virtual Reality and 3D User Interfaces (VR), 2019, pp. 1852–1857. [Online]. Available: https://ieeexplore.ieee.org/document/9044164
- T. Castermans, M. van Garderen, W. Meulemans, M. Nöllenburg, and X. Yuan, “Short Plane Supports for Spatial Hypergraphs,” in Graph Drawing and Network Visualization. GD 2018. Lecture Notes in Computer Science, vol. 11282, T. Biedl and A. Kerren, Eds., Springer International Publishing, 2019, pp. 53–66. doi: 10.1007/978-3-030-04414-5_4#citeas.
- M. Behrisch et al., “Quality Metrics for Information Visualization,” Computer Graphics Forum, vol. 37, Art. no. 3, 2018, doi: 10.1111/cgf.13446.
- C. Schulz, A. Zeyfang, M. van Garderen, H. Ben Lahmar, M. Herschel, and D. Weiskopf, “Simultaneous Visual Analysis of Multiple Software Hierarchies,” in Proceedings of the IEEE Working Conference on Software Visualization (VISSOFT), IEEE, 2018, pp. 87–95. [Online]. Available: https://ieeexplore.ieee.org/document/8530134/
- C. Schulz, A. Nocaj, J. Görtler, O. Deussen, U. Brandes, and D. Weiskopf, “Probabilistic Graph Layout for Uncertain Network Visualization,” IEEE Transactions on Visualization and Computer Graphics, vol. 23, Art. no. 1, 2017, doi: 10.1109/TVCG.2016.2598919.
- M. van Garderen, B. Pampel, A. Nocaj, and U. Brandes, “Minimum-Displacement Overlap Removal for Geo-referenced Data Visualization,” Computer Graphics Forum, vol. 36, Art. no. 3, 2017.
- J. Hildenbrand, A. Nocaj, and U. Brandes, “Flexible Level-of-Detail Rendering for Large Graphs,” Y. Hu and M. Nöllenburg, Eds., 2016. [Online]. Available: https://link.springer.com/content/pdf/bbm%3A978-3-319-50106-2%2F1.pdf
- C. Schulz et al., “Generative Data Models for Validation and Evaluation of Visualization Techniques,” in Proceedings of the Workshop on Beyond Time and Errors: Novel Evaluation Methods for Visualization (BELIV), ACM, 2016, pp. 112–124. doi: 10.1145/2993901.2993907.
- A. Nocaj, M. Ortmann, and U. Brandes, “Adaptive Disentanglement Based on Local Clustering in Small-World Network Visualization,” IEEE Transactions on Visualization and Computer Graphics, vol. 22, Art. no. 6, 2016, [Online]. Available: http://dblp.uni-trier.de/db/journals/tvcg/tvcg22.html#NocajOB16
FOR SCIENTISTS
Projects
People
Publications
Graduate School
Equal Opportunity
FOR PUPILS
PRESS AND MEDIA
© SFB-TRR 161 | Quantitative Methods for Visual Computing | 2019.


